Asians 4x More Likely To Be Associated With Rape Gangs
A meta-analysis of every major official dataset on group-based child sexual exploitation in England adjusted for population reveals Asian individuals at four times their demographic share across every region, every time period, and every dataset examined. The pattern was visible for fifteen years.

For more than a decade, the question of ethnicity in group-based child sexual exploitation has been treated as unspeakable. Not because the data did not exist, but because those responsible for collecting it preferred silence to scrutiny. Reports were buried. Definitions were narrowed. Recording practices were left deliberately inconsistent. And when the subject surfaced at all, it was met with a familiar incantation: the evidence is too poor, too fragmented, too incomplete to draw conclusions.
A new meta-analysis for The Restorationist of thirteen official reports and seven discrete datasets (spanning police records, government inquiries, and independent investigations from 2009 to 2025) suggests otherwise. The evidence, once standardised and population-adjusted, tells a story so consistent across time, geography, and institutional source as to leave very little room for equivocation.
Readers who want a deeper picture into the history of this sordid affair should dive into Kerr's article and our TellSomeone summarised history linked below:
 Oliver Kerr
 Alex Coppen
7 Source Datasets Combined Into A Single England-Wide Picture
Our meta-analysis compiles ethnicity data on recorded individuals from every major public source on group-based child sexual exploitation (GBCSE) in England: the 2011 CEOP thematic assessment, the Berelowitz inquiries of 2012 and 2013, the Anne Longfield children's commissioner dataset, the 2025 Casey Report covering both Greater Manchester and West Yorkshire, and the National Crime Agency's Operation Stovewood investigation into historical abuse in Rotherham.
| Title | Panel / Head | Source |
|---|---|---|
| Independent Inquiry into Child Sexual Exploitation in Rotherham 1997-2013 | Jay Independent Inquiry | independent-inquiry-into-child-sexual-exploitation-in-rotherham |
| Making every child matter ... Everywhere- Thematic assessment 2011 | CEOP Child Exploitation and Online Protection Centre | 1303_Thematic_Assessment_280611c_original.pdf |
| Emerging findings of the OCC’s Inquiry into Child Sexual Exploitation in Gangs and Groups, with a special focus on children in care 2012 | CSEGG Children's commission Berelowitz | Briefing for Rt Hon Michael Gove MP, Secretary of State, on the emerging findings into Child Sexual Exploitation in Gangs and Groups |
| Interim Report 2012 | Home Office Berelowitz | I-thought-I-was-the-only-one-in-the-world.pdf |
| Children’s Commissioner’s Inquiry into Child Sexual Exploitation in Gangs and Group 2013 | CEOP Children's commission Berelowitz | If_only_someone_had_listened.pdf |
| Unheard voices: The sexual exploitation of Asian girls and young women. 2013 | Gohir, S. Muslim Women’s Network UK. | mwnuk.co.uk/go_files/resources/UnheardVoices.pdf |
| Real Voices: Child sexual exploitation in Greater Manchester. 2014 | Coffrey An independent report | Realvoices+Coffey+report+on+child+sexual+exploitation+in+Greater+Manchester.pdf |
| Children’s Commissioner for England on police data on CSE offenders 2015 | Anne Longfield OBE Children's commission Berelowitz | Protecting-children-from-harm-full-report.pdf |
| Reflections on child sexual exploitation. 2015 | Casey Home Office | Reflections on child sexual exploitation |
| The Police Foundation 2016 | Skidmore Police Foundation | Police Foundation Child Sexual Exploitation Briefing.qxd |
| Group-based child sexual exploitation characteristics of offending. 2020 | Home Office | Group-based child sexual exploitation characteristics of offending (accessible version) - GOV.UK |
| An explorative study on perpetrators of child sexual exploitation convicted alongside others. 2020 | Senker Independent Inquiry into Child Sexual Abuse. | An explorative study on perpetrators of child sexual exploitation |
| child sexual exploitation and abuse. 2025 | Casey Report | Child sexual exploitation and abuse |
The literature review contextualises the meta-analysis by identifying recurring themes, methodological approaches, and limitations within existing research. Each report is examined in detail in subsequent sections, with particular emphasis on data quality and the handling of ethnicity.
Together these sources yield approximately 6,400 individual records. Ethnicity was recorded in 79 per cent of cases. The remaining 21 per cent (over 1,300 individuals) had no ethnicity on file at all, a figure worth pausing on in its own right. You can't find a demographic problem if you don't record it in the first place.
The extracted data were standardised into four categories: Asian, White, Other, and Unknown/Missing. These follow standard UK Census groupings.
Crucially, the study does not simply compare raw percentages. Instead it calculates population-adjusted representation ratios: the proportion of recorded individuals in each ethnic group divided by the proportion of the general population in the same region belonging to the same group.
- A ratio of 1.0 would indicate proportional representation.
- Above 1.0 indicates over-representation.
- Below 1.0, under-representation.
This is the method the Home Office should have applied years ago.
Per Capita: Raw Percentages Are Misleading
Across the combined dataset, 41 per cent of recorded individuals with ethnicity data were classified as Asian, 45 per cent as White, and 14 per cent as Other.
At first glance, this appears to show rough parity between Asian and White offenders. It is precisely at this point (the raw percentage) where most previous commentary has stopped, and where most previous commentary has been either lazy or dishonest.
The Asian population of England is 9.6 per cent. The White population is 8.5x the size at 81 per cent (the government's own figures now put the British part at 74.4%). When the proportions of recorded individuals are measured (adjusted) against the populations from which they are drawn, the picture changes entirely.
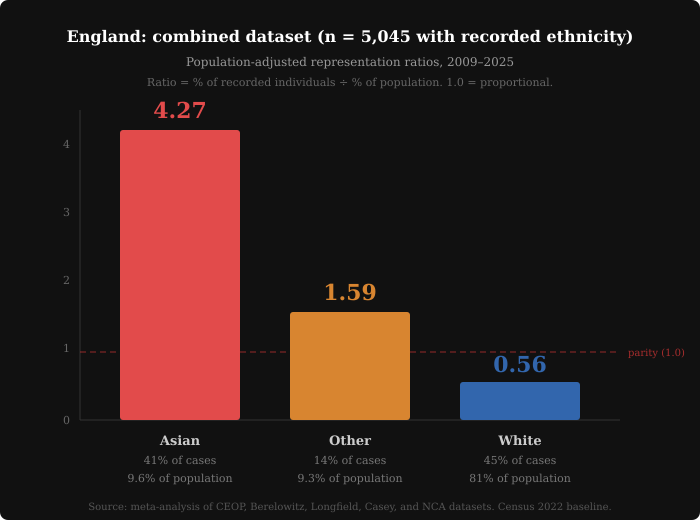
Table 5 Total number and proportion of GBCSE perpetrators by ethnicity and including records where ethnicity is not recorded, adjusted for 2022 UK Census population.
| Asian | White | Other | Total | Missing | Total |
|---|---|---|---|---|---|
| 2067 | 2272 | 704 | 5045 | 1324 | 6367 |
| 42% | 44% | 14% | 21% | 79% included |
Table 6 Relative representation ratios of recorded GBCSE perpetrators by ethnicity compared to England population baseline (2022 Census).
| Ethnic Group | Population (%) | Offenders (%) | Ratio (Offenders ÷ Population) |
|---|---|---|---|
| Asian | 9% | 42% | 4.27 |
| White | 81% | 44% | 0.56 |
| Other | 10% | 14% | 1.59 |
- The representation ratio for Asian recorded individuals is 4.27 (over four times their share of the population).
- For White recorded individuals it is 0.56 (roughly half their population share).
- The Other category sits at 1.59, modestly above parity.
41% (the percentage of recorded individuals classified as Asian) divided by 9.6% (the percentage of England's population who are Asian) gives you 4.27. The same calculation for White recorded individuals: 45% divided by 81% gives 0.56. For the Other category: 14% divided by 9.3% gives 1.59.
- 41 / 9.6 = 4.27
- 45 / 81 = 0.56
- 14 / 9.3 = 1.59
The method is crude, but it is a heuristic to investigate a hypothesis in the absence of more granular police/court data. It is a similarly-crude methodology used in DEI quotas, for example.
To put this in the plainest possible terms: for every Asian individual you would expect to appear in these datasets based on population alone, four appeared. For every White individual you would expect, roughly half appeared.
The Same Pattern Against Local Demographics
The astute Restorationist reader will already have their criticism loaded. They will smell the potential for error intuitively. The headline ratios are at the aggregate national level, but populations are clustered and concentrated regionally. They are not evenly distributed. Correct.
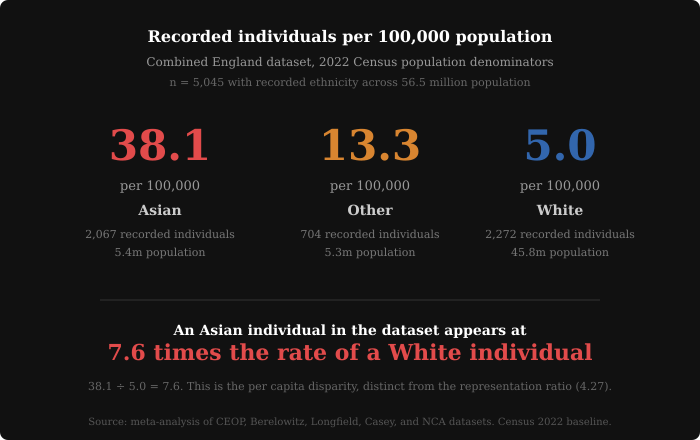
The combined England figure uses national Census data as its population baseline. A reasonable objection is whether the pattern would hold in regions with larger or smaller Asian populations, where the denominator is higher and the ratio should narrow. Two of the seven source datasets (Greater Manchester from the Casey Report and West Yorkshire Police data) permit exactly this test, because they cover defined geographic areas with their own Census figures.
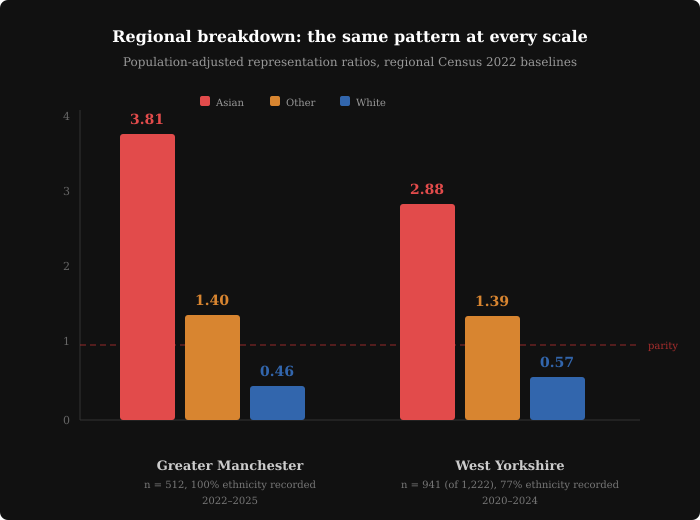
In Greater Manchester (14 per cent Asian, 79 per cent White), 612 recorded individuals were identified across 96 investigations between 2022 and 2025. Ethnicity was recorded in every case. Of these, 53 per cent were classified as Asian, 36 per cent as White, and 11 per cent as Other. The representation ratios: 3.81 (Asian), 0.46 (White), 1.40 (Other).
Table 7 Recorded GBCSE perpetrators by ethnicity (Greater Manchester dataset)
| Asian | White | Other | Total | Missing | Total |
|---|---|---|---|---|---|
| 272 | 186 | 54 | 512 | 0 | 512 |
| 53% | 36% | 11% | 0% | 100% included |
Table 8 Population-adjusted representation ratios (Greater Manchester, 2022 Census baseline)
| Ethnic Group | Population (%) | Offenders (%) | Ratio (Offenders ÷ Population) |
|---|---|---|---|
| Asian | 14% | 53% | 3.81 |
| White | 79% | 36% | 0.46 |
| Other | 8% | 11% | 1.40 |
In West Yorkshire (16 per cent Asian, 77 per cent White), 1,222 recorded individuals were identified between 2020 and 2024, with ethnicity data for 77 per cent. Among those with data, 46 per cent were classified as Asian, 44 per cent as White, and 11 per cent as Other. The ratios: 2.88 (Asian), 0.57 (White), 1.39 (Other).
Table 9 Recorded GBCSE perpetrators by ethnicity (West Yorkshire dataset)
| Asian | White | Other | Total | Missing | Total |
|---|---|---|---|---|---|
| 429 | 413 | 99 | 941 | 281 | 1222 |
| 46% | 44% | 11% | 23% | 77% included |
Table 10 Population-adjusted representation ratios (West Yorkshire, 2022 Census baseline)
| Ethnic Group | Population (%) | Offenders (%) | Ratio (Offenders ÷ Population) |
|---|---|---|---|
| Asian | 16% | 46% | 2.88 |
| White | 77% | 44% | 0.57 |
| Other | 8% | 11% | 1.39 |
The West Yorkshire ratio is lower, in part because the larger Asian population share narrows the gap, but it remains nearly three times the baseline. The direction is identical in both regions. Adjusting for local demographics does not eliminate the disproportionality. It confirms it.
This consistency does not prove causation. Our study is explicit on this point. What it does is foreclose the most common excuse for inaction: the claim there is not enough evidence to identify a pattern.
Table 7 Full list and counts of ethnicity data from perpetrators of mainly GBCSE included in the meta-analysis.
| Reference | Asian | White | Other | Missing | Notes |
|---|---|---|---|---|---|
| CEOP 2011- Thematic assessment | 346 | 367 | 40 | 464 (1100*) | 46 police forces, 22 children’s services and witness statements identified 2300 possible offenders across 2083 victims. (2010-09). *1,100 were excluded from analysis due to a lack of basic information. Remaining 1,200 cases, ethnicity data was unknown for 38%. Where data was available 30% of offenders were White, while 28% were Asian. |
| CESEGG 2012- Berelowitz I thought I was the only one in the world | 415 | 545 | 244 | 318 | 115 written submissions, 70 areas in England, 167 individuals across 78 agencies during 14 site visits. Of 2255 victim records, 1,500 individuals were identified, but there was no data on ethnicity for 21% of them. 545 were recorded as ‘White’, 415 as ‘Asian’, and 244 as ‘Black’. (2010-11). |
| CEOP 2013- Berelowitz If only someone had listened | 230 | 76 | (*0) | 0 | 31 police forces found 306 perpetrators of CSE over 52 gangs. 750 survivor respondents. 52 groups where data provided was useable, half of the groups consisted of all Asian offenders, 11 were all White offenders, 4 were all Black, and 2 were exclusively Arab, and 9 groups where offenders came from a mix of ethnic backgrounds. Looking at the offenders across all groups, of the 306 offenders 75% were Asian. |
| Anne Longfield 2015-Protecting children from harm | 168 | 504 | 252 | 264 | 19 out of 43 forces found of 4000 perpetrators, 1200 were GBCSE. Appendix C Survivor Survey- Respondents weren’t asked perpetrator ethnicity only their own. 42% White/White British, 17% were Black/Black British, 14% Asian/Asian British, and 4% Other. No data on ethnicity was recorded in 22% of cases. (2014). |
| Casey 2025 | 272 | 286 | 54 | 0 | Greater Manchester police identified 612 perpetrators spanning 96 group-based child sexual exploitation investigations 2022-25. |
| Casey 2025 | 429 | 413 | 99 | 281 | West Yorkshire police identified 1222 perpetrators of child sexual exploitation offending 2020-24. |
| Op Stovewood (Rotherham 2015) | 207 | 81 | 35 | 0 | 323 cases from National crime agency’s investigation into historical cases of child exploitation in Rotherham in 2015. |
| Totals | 2067 | 2272 | 724 | 1327 | 5064 / 6390 |
| Representation Percentage | 41% | 45% | 14% | 21% | 79% included |
*- not reported in source; treated as missing within dataset coding framework.
There is a pattern. It is present even as a heuristic in every dataset examined. It almost certainly will be present in many, if not all, the others.
And it has been present for fifteen years.
Research Limitations
The study is methodologically careful (unusually so for a field saturated with advocacy masquerading as research). Several limitations deserve attention.
These are recorded cases, not actual
It goes without saying, but few sexual abuse or rape victims report crimes to the police. In England and Wales, police recorded a peak of 71,227 reported rapes in 2024, the highest annual figure on record. Charges are brought in less than 3% of these cases.
Ethnicity recording is inconsistent
Some entries reflect "self-identification" by the recorded individual. Others are based on police observation. Others still come from victim testimony, meaning a traumatised child's recollection of the appearance of their abuser. These are not equivalent categories of evidence, and the study does not pretend they are.
~20% of cases have no ethnicity recorded at all
Whether the missing data would shift the observed ratios, and in which direction, is unknowable. The study confines its analysis to cases with recorded ethnicity and states this clearly.
The "Asian" census category is itself a blunt instrument
The data encompasses Pakistani, Bangladeshi, Indian, Chinese, Afghan, and Arab populations, groups with vastly different demographic profiles and, where sub-categorisation has been attempted in individual reports, vastly different representation in GBCSE cases. The Indian and Chinese populations alone account for roughly half the total Asian population of England. Were they reclassified into "Other," the Asian population denominator would halve, while the offender numerator would barely move, producing representation ratios significantly higher than those reported here. The study uses historical Census groupings as they stand, which is methodologically conservative.
There is no way to confirm the datasets are fully independent
The absence of unique identifiers across police forces and inquiries means some individuals may appear in more than one dataset. The study treats this as an unquantifiable source of uncertainty and notes any residual duplication would affect precision rather than direction.
These are real limitations present in every prior study on this subject, studies which were nonetheless used for years to argue there was no disproportionality, or to claim the picture was "more complex" than ethnic categories could capture. The limitations did not prevent those conclusions. They should not prevent these.
"Unavailable" Reports Were Sitting In A Public Archive
Five of the reports referenced in the 2025 Casey Report as unavailable were in fact recoverable through the Wayback Machine. This is a detail worth dwelling on. Official sources cited as lost or inaccessible (forming part of the evidential basis for a Home Office-commissioned review) were sitting in a public internet archive.
One need not attribute malice to observe the incentive structure: if the evidence is officially unavailable, it cannot officially be analysed. If it cannot be viewed, no composite picture emerges. And if no composite picture emerges, the absence of evidence becomes the evidence of absence.
Our meta-analysis corrects this by treating all recoverable data as includable, provided it meets the stated inclusion criteria of a minimum sample size of 300 recorded individuals with some form of ethnicity recording.
What A Ratio Does And Does Not Measure
A representation ratio is not a crime rate. It does not tell you the probability of any individual committing an offence. It does not tell you why a pattern exists. It does not account for socioeconomic deprivation, geographic concentration, policing focus, or a hundred other confounding variables.
What it does is answer a narrow but important question:
In the limited recorded data we have on group-based child sexual exploitation in England, are certain ethnic groups appearing at rates higher or lower than their share of the population?
The answer, across every dataset examined, is yes.
The refusal to state this plainly has not protected vulnerable children. It has not improved community relations. It has not advanced the cause of evidence-based safeguarding. It has done one thing only: provided cover for institutions whose failure to act was, and remains, a scandal of the first order.
15 Years Of Evidence
Fifteen years of data. Thirteen reports. Seven datasets. Over six thousand cases. And the central finding is so consistent it barely requires statistical sophistication to grasp: in recorded group-based child sexual exploitation in England, Asian individuals are represented at between three and four times their population share, and this holds as a simple heuristic across every dataset, every region, and every time period examined – using merely the limited data we have..
The methodological caveats are real and properly stated, but they cut both ways. The same data imperfections invoked to dismiss disproportionality (missing records, inconsistent classification, perception-based ethnicity) would, if corrected, be as likely to sharpen the finding as to soften it. The conservative choices embedded in this analysis (retaining Chinese and Indian populations within the Asian denominator, excluding cases without ethnicity data rather than imputing values, treating datasets as partially independent) all tend to produce lower, not higher, representation ratios.
Anyone who has followed this subject for the past decade knows the pattern was visible long before our meta-analysis confirmed it. The Rotherham inquiry saw it. The Berelowitz reports saw it. CEOP saw it. Even the communists saw it. Every frontline professional in children's safeguarding in the north of England saw it. The contribution of this study is not discovery. It is synthesis: the systematic assembly of evidence spread across more than a dozen reports into a single, population-adjusted, methodologically transparent framework.
They did not lack the evidence. They lacked the willingness to compile it, because compiling it would have meant admitting what they had permitted to continue, in full knowledge, for fifteen years, while children were being raped.